Here you'll find html5 canvas practice programs, along with the code to create them.
Writings --- Links --- News --- HTML5 Canvas
Basic Template
<!DOCTYPE HTML>
<html>
<head>
<script>
window.onload = function(){
var canvas = document.getElementById("myCanvas");
var context = canvas.getContext("2d");
context.lineWidth = 10;
context.strokeStyle = "blue";
context.moveTo(50, canvas.height - 50);
context.lineTo(canvas.width - 50, 50);
context.stroke();
};
</script>
</head>
<body>
<div align="center">
<canvas id="myCanvas" width="600" height="200" style = "border:1px solid black;">
</canvas>
</div>
</body>
</html>
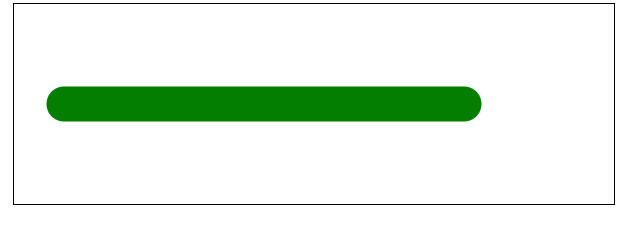
You may use butt, round or square for endpoints of a line.
Here's the code for round:
context.beginPath();
context.lineWidth = 35;
context.lineCap = "round";
context.moveTo(50, 100);
context.lineTo(450, 100);
context.strokeStyle ="green";
context.stroke();
Here's what it creates:
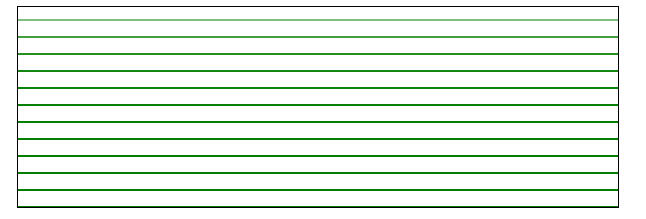
context.lineWidth = 1;
for(var a=0;a<200; a = a + 15)
{
context.moveTo(0, 200-a);
context.lineTo(600, 200-a);
context.strokeStyle ="green";
context.stroke();
}
Shown above is what the code produces.
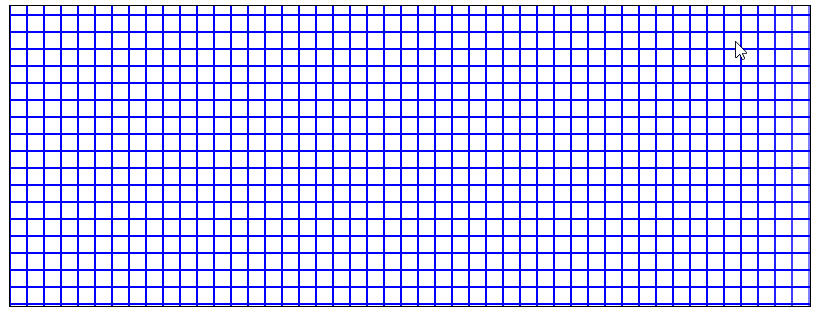
Now we'll add vertical lines to create a graph. Here's the new code:
context.beginPath();
context.lineWidth = 1;
//Horizontal lines
for(var a=0;a<400; a = a + 17)
{
context.moveTo(0, 400-a);
context.lineTo(800, 400-a);
context.strokeStyle ="green";
context.stroke();
}
//Vertical lines
for(var b=0;b<800; b = b + 17)
{
context.moveTo(b, 0);
context.lineTo(b, 600);
context.strokeStyle ="blue";
context.stroke();
}
Here's what we'll get:
Here's the code for viewing:
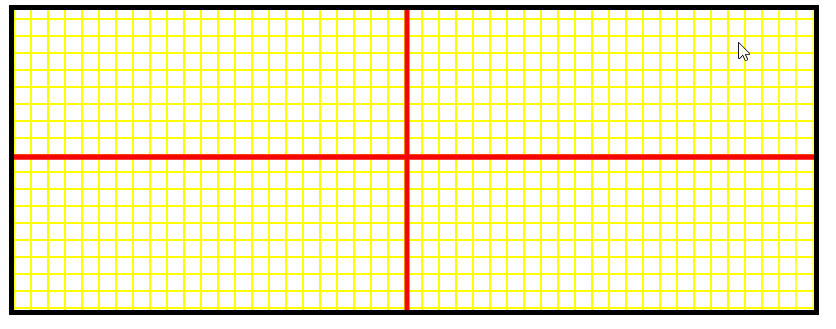
Now we'll change the border style from 1 to 5 px and the colors of both the vertical and horizontal lines to yellow.
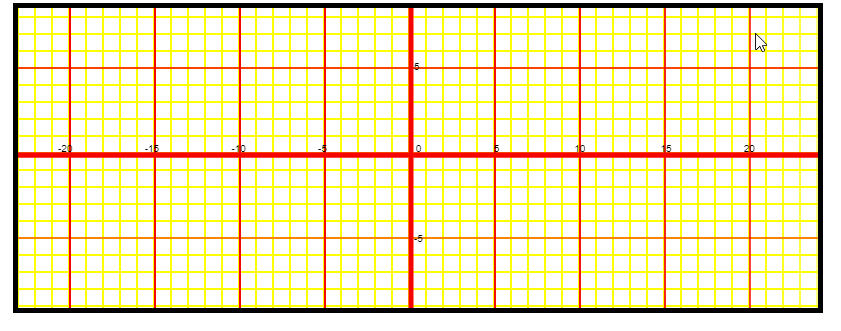
Next we'll add a horizontal and vertical axis thru the middle of our graph.
Here's what we'll have:
Here's the complete code for it:
<!DOCTYPE HTML>
<html>
<head>
<script>
window.onload = function(){
var canvas = document.getElementById("myCanvas");
var context = canvas.getContext("2d");
context.beginPath();
context.lineWidth = 1;
//Horizontal lines
for(var a=0;a<400; a = a + 17)
{
context.moveTo(0, 400-a);
context.lineTo(800, 400-a);
context.strokeStyle ="yellow";
context.stroke();
}
//Vertical lines
for(var b=0;b<800; b = b + 17)
{
context.moveTo(b, 0);
context.lineTo(b, 600);
context.stroke();
}
// Add horizontal and vertical axis thr graph.
context.beginPath();
context.lineWidth = 5;
context.moveTo(0, 147);
context.lineTo(800, 147);
context.restore();
context.strokeStyle = "red";
context.stroke();
context.moveTo(393, 0);
context.lineTo(393, 600);
context.stroke();
}
</script>
</head>
<body>
<div align="center">
<canvas id="myCanvas" width="800" height="300" style = "border:5px solid black ">
</canvas>
</div>
</body>
</html>
Notice I've added context.beginPath(); in the code.
Without that you probably noticed the line properties default to the last stroke command.
Here is the code so far:
Next we need to add interval marks and captions to make the graph easier to read.
Here's the complete code for that.
<!DOCTYPE HTML>
<html>
<head>
<script>
window.onload = function(){
var canvas = document.getElementById("myCanvas");
var context = canvas.getContext("2d");
context.beginPath();
context.lineWidth = 1;
//Horizontal lines
for(var a=0;a<400; a = a + 17)
{
context.moveTo(0, 400-a);
context.lineTo(800, 400-a);
context.strokeStyle ="yellow";
context.stroke();
}
//Vertical lines
for(var b=0;b<800; b = b + 17)
{
context.moveTo(b, 0);
context.lineTo(b, 600);
context.stroke();
}
// Add horizontal and vertical axis thr graph.
context.beginPath();
context.lineWidth = 5;
context.moveTo(0, 147);
context.lineTo(800, 147);
context.restore();
context.strokeStyle = "red";
context.stroke();
context.moveTo(393, 0);
context.lineTo(393, 600);
context.stroke();
//Add lines at intervals
context.beginPath();
context.lineWidth = 1;
context.strokeStyle = "red";
//Vertical line markers for every five units
for(var c=0;c<10; c = c + 1)
{
context.moveTo(52 + (c * 81)+(c*4), 0);
context.lineTo(52 + (c * 81)+(c*4), 600);
context.stroke();
}
//horizontal line markers for +5 and -5
context.beginPath();
context.moveTo(0, 60);
context.lineTo(900, 60);
context.stroke();
context.moveTo(0, 230);
context.lineTo(900, 230);
context.stroke();
context.fillText("-20 -15 -10 -5 0 5 10 15 20", 40, 144);
context.fillText("5",396,62);
context.fillText("-5", 396, 234);
}
</script>
</head>
<body>
<div align="center">
<canvas id="myCanvas" width="800" height="300" style = "border:5px solid black ">
</canvas>
</div>
</body>
</html>
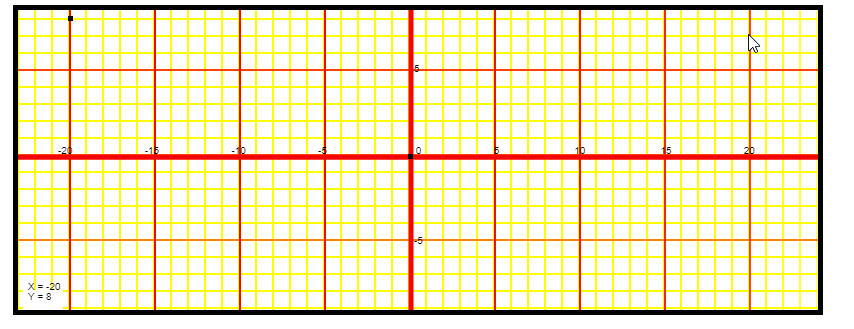
Now let's add a button to pick a random location on the graph, with the X and Y coordinates.
In this graph our X locations range from -23 to +23 and our Y locations range from +8 to -9.
Here's the start:
<!DOCTYPE HTML>
<html>
<head>
<script>
window.onload = function(){
var canvas = document.getElementById("myCanvas");
var context = canvas.getContext("2d");
context.beginPath();
context.lineWidth = 1;
//Horizontal lines
for(var a=0;a<400; a = a + 17)
{
context.moveTo(0, 400-a);
context.lineTo(800, 400-a);
context.strokeStyle ="yellow";
context.stroke();
}
//Vertical lines
for(var b=0;b<800; b = b + 17)
{
context.moveTo(b, 0);
context.lineTo(b, 600);
context.stroke();
}
// Add horizontal and vertical axis thr graph.
context.beginPath();
context.lineWidth = 5;
context.moveTo(0, 147);
context.lineTo(800, 147);
context.restore();
context.strokeStyle = "red";
context.stroke();
context.moveTo(393, 0);
context.lineTo(393, 600);
context.stroke();
//Add lines at intervals
context.beginPath();
context.lineWidth = 1;
context.strokeStyle = "red";
//Vertical line markers for every five units
for(var c=0;c<10; c = c + 1)
{
context.moveTo(52 + (c * 81)+(c*4), 0);
context.lineTo(52 + (c * 81)+(c*4), 600);
context.stroke();
}
//horizontal line markers for +5 and -5
context.beginPath();
context.moveTo(0, 60);
context.lineTo(900, 60);
context.stroke();
context.moveTo(0, 230);
context.lineTo(900, 230);
context.stroke();
context.fillText("-20 -15 -10 -5 0 5 10 15 20", 40, 144);
context.fillText("5",396,62);
context.fillText("-5", 396, 234);
// Create random dot on graph
var ranX1 = Math.floor((Math.random() * 47));
var ranY1 = Math.floor((Math.random() * 18));
// Put point at X/Y location
context.beginPath();
context.arc((ranX1* 20), 200 + (ranY1 * 20), 1, 0, 2 * Math.PI, true);
context.fill();
//Place square at 0,0 location
context.fillRect(390,144, 5,5);
;
var ranX = ranX1 -22;
var ranY = ranY1 - 7
context.fillRect(390 + (ranX * 17),142 - (ranY * 17), 5,5);
context.beginPath();
context.fillStyle = "white";
context.fillRect(5, 280, 40, 70);
context.beginPath();
context.fillStyle = "black";
// Add the location
context.fillText('X = ' + ranX, 10, 280);
context.fillText('Y = ' + ranY, 10, 290);
}
</script>
</head>
<body>
<div align="center">
<canvas id="myCanvas" width="800" height="300" style = "border:5px solid black ">
</canvas>
</div>
</body>
</html>
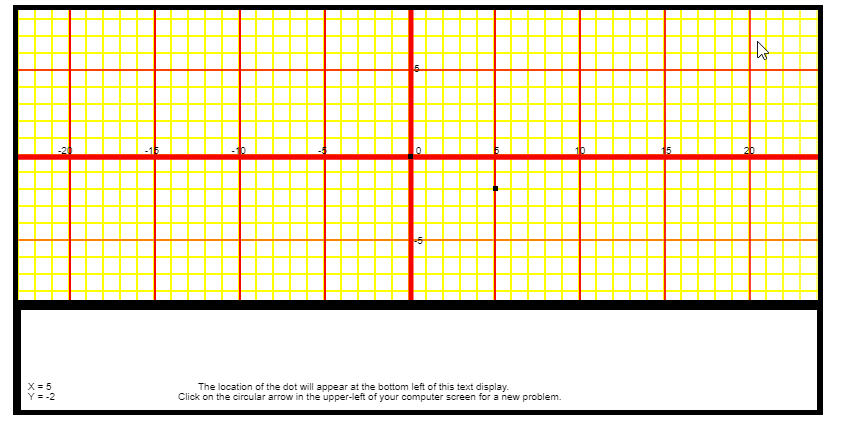
Here's an update:
One of my favorite programming tools is working with graphics using HTML5 canvas.
Here you're going to find various levels of math and algebra problems, that will randomly change their values each time you access them.
After you prepare your answer then you'll be able to see the solution, and also see a walk-thru of one way to reach that solution on the more difficult problems.
I'll start out with very basic area problems, and from there go to more complex problems involving more than just several steps to solve.
Comments of course will be appreciated. My email is shown below, and you're welcome as I create and develop the programs,
to give feedback on your use of the programs.
Another program example for area of a parallelogram.
parallelogram3
Find the area of a trapezoid, given the length of the two bases and the height.
trapezoid
Problems with circles and isosceles triangles
circlesAndIsoscelesTriangles
Another right triangle problem.
legRtTriangle
Find the green area of a square, outside the red circle that touches the four sides of the square.
CircleAreaProblem
Find the time at which two cars traveling toward each other will meet.
distanceRateTimeProblems
Another cylinder surface area problem.
cylinderAreaProblems2
Finding the value of one unknown in equations.
equations
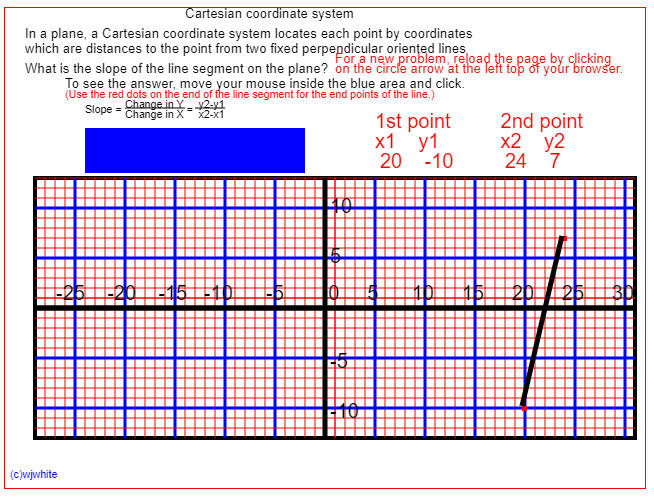
Finding the slope of a line.
Slope Problems
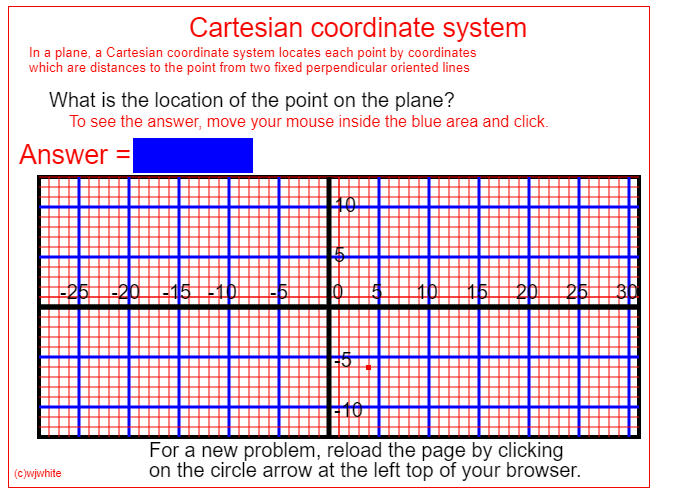
Here's the latest on the Cartesian coordinate system program:
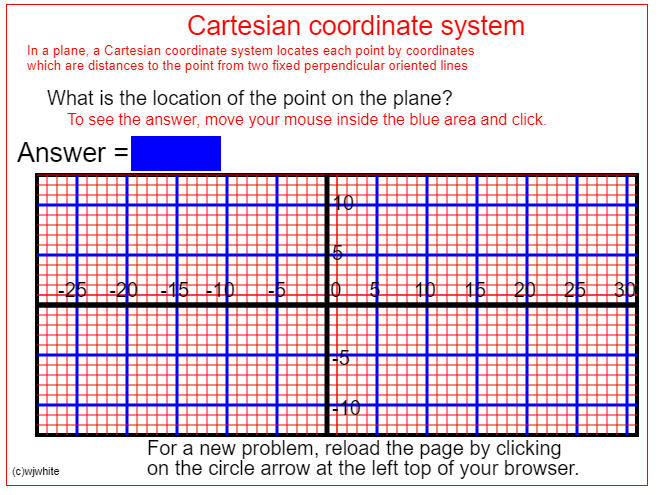
Here's two displays of the final program:
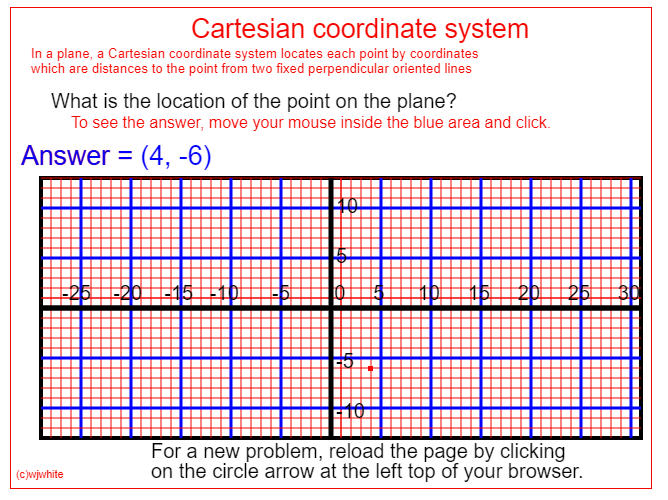
And after the blue area is clicked:
Here's the code:
Here's a printout of the code:
<!DOCTYPE html>
<html>
<head>
<meta http-equiv="Content-type" content="text/html; charset=utf-8">
<title> Basic Area Problems</title>
<script type="text/javascript">
// This function will be called once the page loads completely
function pageLoaded(){
// Get a handle to the canvas object
var canvas = document.getElementById("testcanvas");
var context = canvas.getContext("2d");
// DRAWING TEXT
// Modify the font
context.font = "15pt Arial";
context.fillText("What is the location of the point on the plane?", 40, 100);
context.fillText("For a new problem, reload the page by clicking", 140, 450);
context.fillText("on the circle arrow at the left top of your browser.", 140, 470);
context.font = "12pt Arial";
context.fillStyle = "red";
context.fillText("To see the answer, move your mouse inside the blue area and click.", 60, 120);
// Get two random numbers
var raw = Math.random();
var raw2 = Math.random();
// Check to see if they are the same
var times100 = Math.ceil(raw * 10);
var times1002 = Math.ceil(raw2 * 10);
// Make sure times100 <= times1002
// Draw Triangle
context.lineWidth = 2;
context.beginPath();
// Add heading & Description
context.font = "20pt Arial";
context.fillText("Cartesian coordinate system", 180, 30);
context.font = "10pt Arial";
context.fillText("In a plane, a Cartesian coordinate system locates each point by coordinates", 20, 50);
context.fillText("which are distances to the point from two fixed perpendicular oriented lines", 20,65);
// Add box around plane
context.lineWidth = 4;
context.strokeRect(30,170, 600, 260);
var x1 = 0;
var z1 = 0;
// Draw horizontal lines
context.strokeStyle = "red";
context.lineWidth = 1;
for(var x1=0;x1<30; x1=x1+1)
{
context.beginPath();
context.moveTo(330 + (x1 * 10), 170);
context.lineTo(330 + (x1 * 10), 430);
context.stroke();
context.beginPath();
context.moveTo(330 - (x1 * 10), 170);
context.lineTo(330 - (x1 * 10), 430);
context.stroke();
}
context.strokeStyle = "red";
for(var y1=0;y1<13; y1 = y1 + 1)
{
context.beginPath();
context.moveTo(30, 290- (y1 * 10));
context.lineTo(630,290- (y1 * 10));
context.stroke();
context.beginPath();
context.moveTo(30, 290 + (y1 * 10));
context.lineTo(630,290 + (y1 * 10));
context.stroke();
}
context.strokeStyle = "blue";
context.lineWidth = 3;
for(var x1=0;x1<40; x1=x1+5)
{
context.beginPath();
context.moveTo(320 + (x1 * 10), 170);
context.lineTo(320 + (x1 * 10), 430);
context.stroke();
}
for(var x1=0;x1<30; x1=x1+5)
{
context.beginPath();
context.moveTo(320 - (x1 * 10), 170);
context.lineTo(320 - (x1 * 10), 430);
context.stroke();
}
for (var y1 = 0; y1<15; y1 =y1 + 5)
{
context.beginPath();
context.moveTo(30, 200 + 100-(y1 * 10));
context.lineTo(630, 200 + 100- (y1*10));
context.stroke();
}
for (var y1 = 0; y1<15; y1 =y1 + 5)
{
context.beginPath();
context.moveTo(30, 200 + 100+(y1 * 10));
context.lineTo(630, 200 + 100+ (y1*10));
context.stroke();
}
// Add line to complete horizontal lines
context.beginPath()
context.strokeStyle = "red";
context.lineWidth = 1;
context.moveTo(30, 420);
context.lineTo(630, 420);
context.stroke();
// Horizontal line
context.strokeStyle = "black";
context.beginPath();
context.lineWidth = 5;
context.moveTo(30, 300);
context.lineTo(630, 300);
context.stroke();
// Vertical line
context.moveTo(320,170);
context.lineTo(320, 430);
context.stroke();
// Add division lines
// horizontal label
context.beginPath();
context.font = "15pt Arial";
context.fillStyle = "black";
context.fillText("-25 -20 -15 -10 -5 0 5 10 15 20 25 30", 51, 292);
// Vertical labels
context.fillText("5", 325, 255);
context.fillText("10", 325, 205);
context.fillText("-5", 325, 360);
context.fillText("-10", 325, 410);
// Create random dot on chart
var ranX1 = Math.floor((Math.random() * 59));
var ranY1 = Math.floor((Math.random() * 25));
var ranX2 = ranX1 - 29;
var ranY2 = ranY1 - 12;
context.fillStyle = "red";
// Set point on graph
context.fillRect(317+ (ranX2 * 10) , 298 - (ranY2 * 10),5,5);
// Provide answer
context.font = "20pt Arial";
context.fillText("Answer = ("+ ranX2 + ", " + ranY2 + ")", 10, 157 );
//context.fillText("Answer = ("+ ranX2 + ", " + ranY2 + ")", 250, 157 );
context.font = "8pt Arial";
context.fillText("(c)wjwhite", 5, 470);
context.font = "20pt Arial";
context.fillStyle = "blue";
context.fillRect(124,131, 120, 35); //Display answer.
canvas.onmousedown = function (e) {
context.fillStyle = "white";
context.fillRect(124, 131, 120, 35); //Display answer.
context.fillStyle = "blue";
context.fillText("Answer = ("+ ranX2 + ", " + ranY2 + ")", 10, 157 );
//context.fillText("Answer = ("+ ranX2 + ", " + ranY2 + ")", 250, 157 );
}
}
</script>
</head>
<body onload="pageLoaded();">
<div align="center">
<canvas width="640" height="480" id="testcanvas" style="border: 1px solid red;">
Your browser does not support HTML5 Canvas. Please shift to a newer browser.
</canvas>
</div>
</body>
</html>
We're almost finished with the program:
Here's one display:
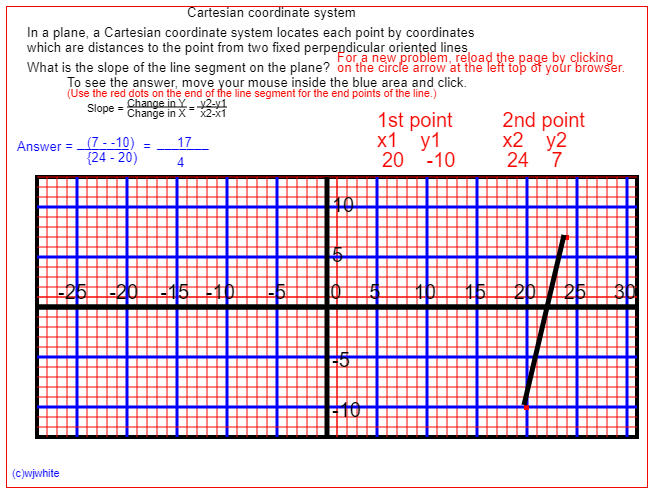
Here's the result when the mouse clicks on the blue area:
Here's a link to the program:
Here's a code printout of the program:
<!DOCTYPE html>
<html>
<head>
<meta http-equiv="Content-type" content="text/html; charset=utf-8">
<title> Basic Area Problems</title>
<script type="text/javascript">
// This function will be called once the page loads completely
function pageLoaded(){
// Get a handle to the canvas object
var canvas = document.getElementById("testcanvas");
var context = canvas.getContext("2d");
// DRAWING TEXT
// Modify the font
context.font = "10pt Arial";
context.fillText("What is the slope of the line segment on the plane?", 20, 65);
context.beginPath();
context.fillStyle = "red";
context.fillText("For a new problem, reload the page by clicking", 330, 55);
context.fillText("on the circle arrow at the left top of your browser.", 330, 65);
context.fillStyle = "black";
context.fillText("To see the answer, move your mouse inside the blue area and click.", 60, 80);
context.fillStyle = "red";
context.font = "8pt Arial";
context.strokeStyle = "black";
context.fillText("(Use the red dots on the end of the line segment for the end points of the line.)", 60, 90);
context.beginPath();
context.fillStyle = "black";
context.fillText("Slope = = ",80,105);
context.fillText("Change in Y y2-y1", 120,100);
context.fillText("Change in X x2-x1", 120,110);
context.beginPath();
context.moveTo(120, 100);
context.lineTo(180, 100);
context.stroke();
context.beginPath();
context.moveTo(190, 100);
context.lineTo(220, 100);
context.stroke();
// Get two random numbers
var raw = Math.random();
var raw2 = Math.random();
// Check to see if they are the same
var times100 = Math.ceil(raw * 10);
var times1002 = Math.ceil(raw2 * 10);
// Make sure times100 <= times1002
// Draw Triangle
context.lineWidth = 2;
context.beginPath();
// Add heading & Description
context.font = "10pt Arial";
context.fillText("Cartesian coordinate system", 180, 10);
context.font = "10pt Arial";
context.fillText("In a plane, a Cartesian coordinate system locates each point by coordinates", 20, 30);
context.fillText("which are distances to the point from two fixed perpendicular oriented lines", 20,45);
// Add box around plane
context.lineWidth = 4;
context.strokeRect(30,170, 600, 260);
var x1 = 0;
var z1 = 0;
// Draw horizontal lines
context.strokeStyle = "red";
context.lineWidth = 1;
for(var x1=0;x1<30; x1=x1+1)
{
context.beginPath();
context.moveTo(330 + (x1 * 10), 170);
context.lineTo(330 + (x1 * 10), 430);
context.stroke();
context.beginPath();
context.moveTo(330 - (x1 * 10), 170);
context.lineTo(330 - (x1 * 10), 430);
context.stroke();
}
context.strokeStyle = "red";
for(var y1=0;y1<13; y1 = y1 + 1)
{
context.beginPath();
context.moveTo(30, 290- (y1 * 10));
context.lineTo(630,290- (y1 * 10));
context.stroke();
context.beginPath();
context.moveTo(30, 290 + (y1 * 10));
context.lineTo(630,290 + (y1 * 10));
context.stroke();
}
context.strokeStyle = "blue";
context.lineWidth = 3;
for(var x1=0;x1<40; x1=x1+5)
{
context.beginPath();
context.moveTo(320 + (x1 * 10), 170);
context.lineTo(320 + (x1 * 10), 430);
context.stroke();
}
for(var x1=0;x1<30; x1=x1+5)
{
context.beginPath();
context.moveTo(320 - (x1 * 10), 170);
context.lineTo(320 - (x1 * 10), 430);
context.stroke();
}
for (var y1 = 0; y1<15; y1 =y1 + 5)
{
context.beginPath();
context.moveTo(30, 200 + 100-(y1 * 10));
context.lineTo(630, 200 + 100- (y1*10));
context.stroke();
}
for (var y1 = 0; y1<15; y1 =y1 + 5)
{
context.beginPath();
context.moveTo(30, 200 + 100+(y1 * 10));
context.lineTo(630, 200 + 100+ (y1*10));
context.stroke();
}
// Add line to complete horizontal lines
context.beginPath()
context.strokeStyle = "red";
context.lineWidth = 1;
context.moveTo(30, 420);
context.lineTo(630, 420);
context.stroke();
// Horizontal line
context.strokeStyle = "black";
context.beginPath();
context.lineWidth = 5;
context.moveTo(30, 300);
context.lineTo(630, 300);
context.stroke();
// Vertical line
context.moveTo(320,170);
context.lineTo(320, 430);
context.stroke();
// Add division lines
// horizontal label
context.beginPath();
context.font = "15pt Arial";
context.fillStyle = "black";
context.fillText("-25 -20 -15 -10 -5 0 5 10 15 20 25 30", 51, 292);
// Vertical labels
context.fillText("5", 325, 255);
context.fillText("10", 325, 205);
context.fillText("-5", 325, 360);
context.fillText("-10", 325, 410);
// Create random dot on chart
var ranX1 = Math.floor((Math.random() * 59));
var ranY1 = Math.floor((Math.random() * 25));
var ranX2 = ranX1 - 29;
var ranY2 = ranY1 - 12;
context.fillStyle = "red";
context.fillText(ranX2+ " " + ranY2 ,500, 160);// Sets point location for display
// Set point on graph
context.fillRect(317+ (ranX2 * 10) , 298 - (ranY2 * 10),5,5);
// Create 2nd random dot on chart
var ranX3 = Math.floor((Math.random() * 59));
var ranY3 = Math.floor((Math.random() * 25));
var ranX4 = ranX3 - 29;
var ranY4 = ranY3 - 12;
context.fillStyle = "red";
context.fillText(ranX4+ " " + ranY4 ,375, 160);// Sets point location for display
context.fillText("1st point 2nd point", 370, 120);
context.fillText("x1 y1 x2 y2", 370, 140);
context.stroke();
// Set point on graph
context.fillRect(317+ (ranX4 * 10) , 298 - (ranY4 * 10),5,5);
// Now connect the two dots to create a line segment
context.beginPath();
context.moveTo(317+ (ranX2 * 10) , 298 - (ranY2 * 10),5,5);
context.lineTo(317+ (ranX4 * 10) , 298 - (ranY4 * 10),5,5);
context.stroke();
// Provide answer
context.beginPath();
context.font = "20pt Arial";
context.fillStyle = "blue";
context.font = "8pt Arial";
context.fillText("(c)wjwhite", 5, 470);
context.font = "20pt Arial";
context.fillRect(80,120, 220, 45); //Display answer.
canvas.onmousedown = function (e) {
context.fillStyle = "white";
context.fillRect(80, 120, 220, 45); //Display answer.
context.fillStyle = "blue";
context.font = "10pt Arial";
context.fillText("Answer = =", 10, 144);
context.fillText("_______", 70, 140);
context.fillText("_______", 150, 140);
context.fillText("("+ranY2 +" - " + ranY4+")", 80, 140 );
context.fillText("{"+ranX2 +" - " + ranX4+")", 80, 155 );
var y5 = ranY2-ranY4;
var x5 = ranX2-ranX4;
context.fillText(y5,170, 140);
context.fillText(x5,170, 160);
}
}
</script>
</head>
<body onload="pageLoaded();">
<div align="center">
<canvas width="640" height="480" id="testcanvas" style="border: 1px solid red;">
Your browser does not support HTML5 Canvas. Please shift to a newer browser.
</canvas>
</div>
</body>
</html>
Now aside from tighting up the code, we're still not done.
If the numerator becomes 0, then there is no slope.
The fraction may be able to be reduced.
So... this is the start.
Now run the program and look for ways you can improve its appearance.